The 80/20 ML compiler
I have spent a fair amount of time exploring ML compilers. I used to equate complexity with performance. But ML compiler are quite unique because the hardware is often so simple.
So this weekend I tried building the 80/20 ML compiler. The premise is very simple, get within 80% performance of MLX using the least effort possibe. My hypothesis was that this should require just one optimisation pass of operator fusion and blazingly fast kernels.
My test case was CLIP’s ViT-B/16 image tower on my M4 Pro. I had previously implemented ViT, and small enought to run on my machine. The first forward pass took 147.6 ms. By the end of this weekend project, we will bring it down to 13.52 ms, against MLX’s 13.38 ms!
The compiler I wanted to build
The first part of creating a 20% effort compiler is stealing other’s homework taking inspiration from others.
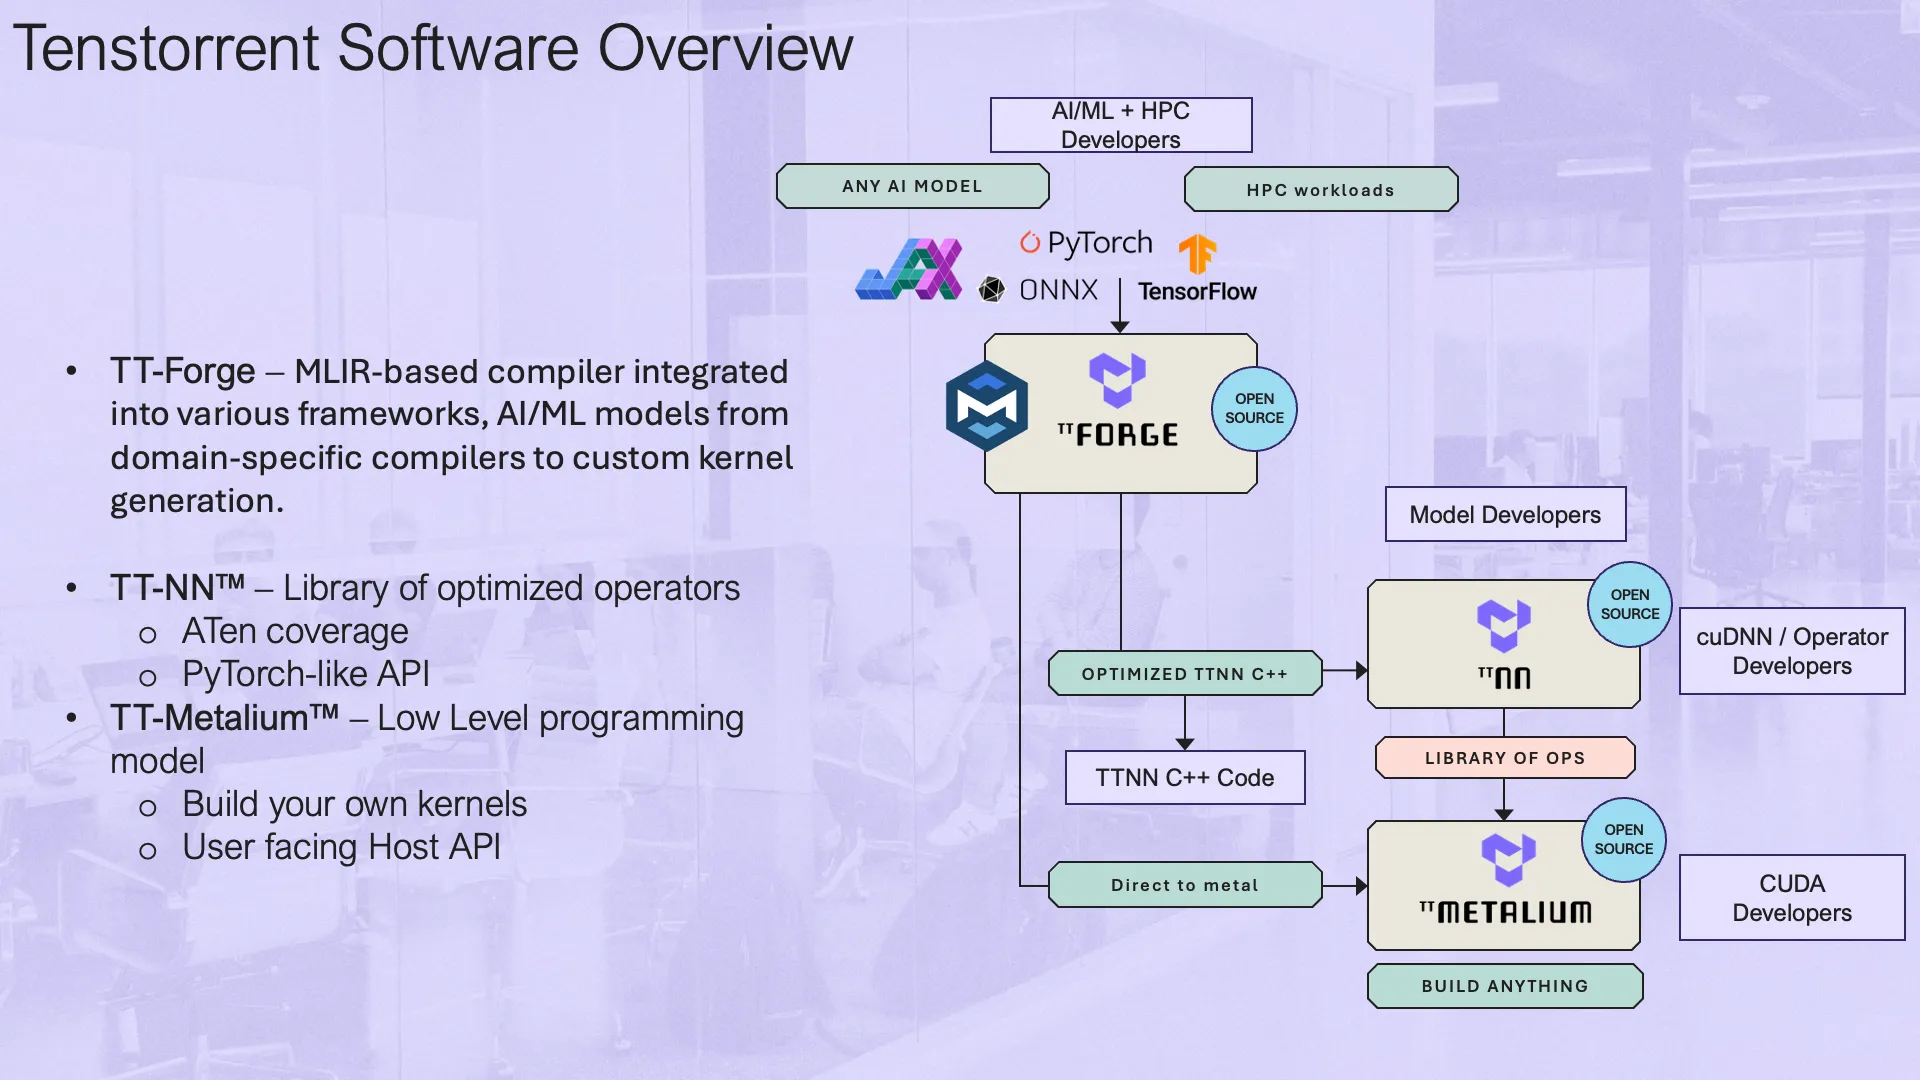
Tenstorrent Compiler Overview
I particularly like this diagram about the Tenstorrent compiler stack because it clearly shows the general 3 overall layers:
- TT-Forge aka talking to the frontend. For this, we will use our own jax like library.
- TT-NN aka a library of ML operations like linear, relu, etc. For this, we will define our own jax.nnx like library.
- TT-Metalium aka the kernels! For this we will use Metal.
But we are doing the 20% version, we can’t define kernels for every NN op under the sun. StableHLO which is a compatibility layer has around 100 NN ops defined! Here we take inspiration from Tinygrad and Luminal. They have few set of core primitive operations. All the NN ops are defined using these primitive operations. This is important for us, because now we have to define only a few core kernels.
| Category | Operations |
|---|---|
| Memory | CONST LOAD STORE COPY |
| Binary Elementwise | ADD MUL SUB DIV MAX |
| Unary Elementwise | NEG RECIP EXP SQRT RSQRT TANH |
| Reduction | REDUCE_SUM REDUCE_MAX |
| Linear Algebra | GEMM |
| Tensor Manipulation | IM2COL CAT |
So this is how the overall pipeline looks like:
Write t
GPU buffer
Write y
Fusion is essentially the only graph optimization pass in this compiler. It is one switch with four structural rules:
- Combine private elementwise chains
- Absorb elementwise tails into GEMMs
- Absorb pointwise prologues into reductions
- Combine private last-axis chains into row kernels.
There is no autotuner, search procedure (maybe at some point based on luminal), or flash attention in this version.
I hope you can see how little we are doing. Every high level NN op is composed of very few primitive operations. Then we pass it through one pass of fusion, which has just 4 rules. And then having an agent optimise kernels for our workload. Thats it!
Getting to the 80% line
For a fixed amount of work, relative throughput is reference latency divided by compiler latency. So 80% of MLX’s speed means taking at most 1.25 times as long. With MLX around 12.7–13 ms during development, my target was roughly 16 ms.
Here is the timeline to crossing it.
Start with fusion
The first end-to-end comparison was 147.6 ms without fusion and 127.6 ms with it. Kernel count dropped from 643 to 332 by combining elementwise chains, GEMM tails, and reduction prologues. Fusion was there very early; every later checkpoint in the timeline keeps it enabled. The last-axis row rule came later as an extension of that same pass.
Then, make the expensive arithmetic fast
ViT-B/16 does about 35 GFLOP per image. Almost all of it is in the transformer blocks’ matrix multiplications. This means the GEMM needs to be blazingly fast.
The first GEMM was naive: a scalar multiply-add loop per thread. The model took 127 ms for that. Combining cheap operations only gets you so far when the expensive operation is slow.
A 64 × 64 tiled GEMM using Metal simdgroup matrix operations brought that to 93 ms. I should also mention that these kernel optimisations were done by 6.1 Sol end to end. I also gave it the Xcode Cli for profiling.
Then, stop moving the entire model
Then the trace exposed that I was copying roughly 345 MB of vision-tower weights on every forward. In one trace, that cost about 19 ms by itself.
Keeping weights, outputs, and metadata buffers allocated brought the forward down to about 62 ms. This feels like optimisation 101: keep things cached.
At this point, profiling changed the story. Reductions were consuming about 40 ms of roughly 60 ms of GPU work. The matmuls were no longer the biggest problem.
A reduction needs more than one thread
The old layer-norm reduction assigned one thread to a row and made it walk all 768 values.
Cooperating across the row with simdgroup reductions, along with vectorized elementwise loads and stores, took the model from 62 ms to 24.9 ms.
The bottleneck keeps changing! GEMM was the bottleneck at 127ms, then reduction ops and now GEMM again became the biggest bottleneck.
Some plausible optimizations barely helped
Cleaning up the GEMM epilogue moved 24.9 ms to 24.5 ms. Bias and QuickGELU were already fused into the matmul, and their cost was small next to the multiply-adds.
Software-pipelined prefetching of the next K tile was worse: 26.6 ms versus 24.4 ms without it. I removed it. A bigger K step and an alternative tile layouts did not help either.
So back to more profiling.
Compile once, replay the plan
I was still rebuilding the execution schedule during every forward pass. Caching the schedule and Metal pipelines, and sharing a compute encoder, brought 24.5 ms down to 18.1 ms.
MLX’s timed path was already using a compiled graph.
One more rule, rather than two more named kernels
At this point, I was out of weekly quota, so I had GLM 5.3 Flash have a got at it. It identified that layer-norm and softmax could be fused, so it bypassed the primitive op mapping for it and directly wrote fused metal kernels for it. But we are doing the 80/20 compiler. So here I had to remove that exception and replaced by just one more rule for fusion.
Softmax and layer norm both contain private chains of elementwise operations and last-axis reductions. Those chains were making repeated trips through memory. The compiler could instead emit one row kernel from the operations already in the graph.
That rule covers softmax, layer norm, and the final L2 normalization without naming any of them. Values stay in registers while a simdgroup cooperates on the reductions. Shared values that escape the chain are still stored, and unsupported layouts fall back to the existing kernels.
Emit its UOps together.
Reductions communicate within the simdgroup.
Kernel count fell from 332 to 164. Latency fell from 18.1 ms to 13.6 ms in that development pass. The original 80% target was behind us.
What the final number actually measures
The final pass used an Apple M4 Pro with 16 GPU cores, f32 arithmetic, and MLX 0.29.3. CLIP ViT-B/16 ran at batch 1 with 224 × 224 images. Each of three photos received three warmups followed by ten timed forwards; the headline numbers average across the photos.
Weights and compiled plans were resident before timing. Both paths included input and output transfer, from and to host. This is a warmed host-call latency comparison, not just a sum of GPU kernel times.
| Final ViT comparison | Latency |
|---|---|
| MLX, compiled | 13.38 ms |
| 80/20 compiler, fusion on | 13.52 ms |
| 80/20 compiler, fusion off | 22.92 ms |
Fusion and blazing kernels is all we need!
And then I tried LLM
I wanted to test if the perf will transfer to other models, and so I tried BERT and SmolLM2
| Workload | MLX | My compiler | Throughput vs. MLX |
|---|---|---|---|
| CLIP ViT-B/16 image tower | 13.38 ms | 13.52 ms | 98.9% |
| BERT-base, 12 encoder blocks, 11 tokens | 3.61 ms | 9.31 ms | 38.7% |
| SmolLM2-360M, 32-block prefill, 32 tokens | 18.55 ms | 26.74 ms | 69.4% |
So the honest result is that the small compiler gets remarkably close on the ViT I optimized, and misses the target on the other measured workloads. SmolLM2 also faces MLX’s optimized scaled-dot-product attention while my compiler expands attention into separate operations.
That seems like a good place to pick up next. Maybe a little search can help choose better implementations.